
Introduction
Can I really call myself a blue teamer if I didn’t do a writeup on HackSmarter’s FIRST blueteam lab??
The Situation
EmberForge Studios just got breached. Their upcoming title Neon Shadows was leaked to underground forums before release. Lead Artist Lisa Martin reported strange behavior on her workstation after opening a file from her desktop. 48 hours later, source code was everywhere.
You’ve been brought in to figure out what happened.
Identifying Initial Access
Accessing Splunk
We can log into our Splunk instance by navigating to the http://IP:8000:
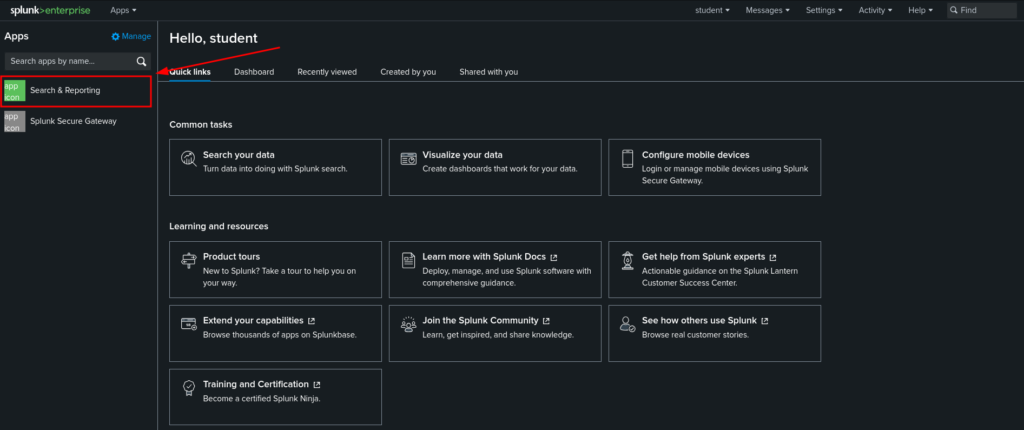
We can login with the supplied credentials “student:Student123!” after logging in we will be sent to the main menu of our Splunk instance. We can click on the “Search & Reporting” tab on the left to begin carving through our data:
Where Do We Start?
Splunk uses indexes, which you can think of like big buckets storing all of the data ingested by our security tools. For example, events from the firewall can be organized into the firewall index, etc.
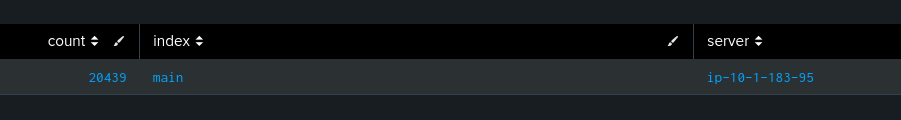
Here is a query we can run that will show us all of the available indexes we can search:
| eventcount summarize=f index=*If we run this, we can see we only have one index with roughly 20,000 events:
Searching for Events from Lisa
From here, we know that Lisa Martin had reported strange behavior the day before the leak, this is a good place to start. We want to know what this user was doing around the time of the leak.
In this case, we may want to do a blanket search across all indexes and for that we can use a wildcard:
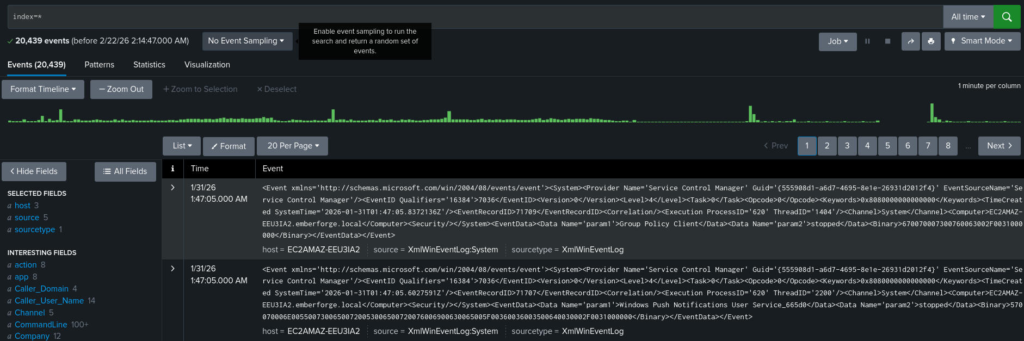
We can then filter specifically for event’s from Lisa using the User field:
index=main User="EMBERFORGE\\lmartin"We now want to look for strange network connections or abnormal processes ran by this user. We can do this using sysmon, a great resource for this all the different EventIDs is UltimateWindowsSecurity:
We can create the following Splunk query, when we run this, we are left with 98 events to look through. We can make all of this info a little easier on our eyes by formatting it into a table, then we can sort it based on when it occurred:
index=main User="EMBERFORGE\\lmartin" EventID=1 | table _time User Image CommandLine | sort _time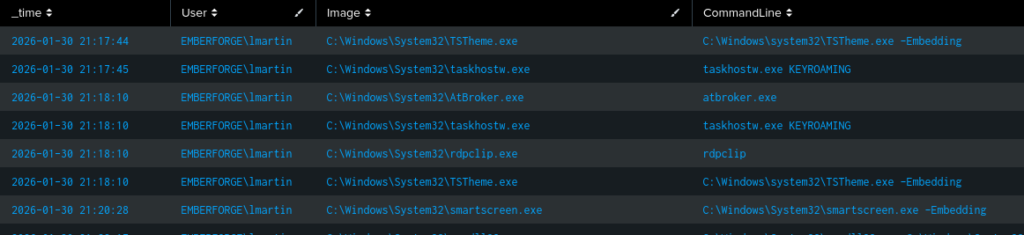
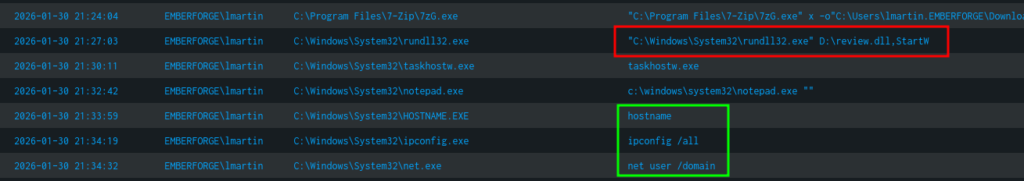
Now if we pay close attention to the CommandLine column we can see the commands ran by the user. Doing some basic filtering, we will be able to see that the user loaded a DLL from a different drive. This is definitely odd to see a .dll executed from a different drive, this could be a removable storage device, USB, or an ISO.

Filtering for Sysmon EventID 11 (FileCreation) slightly before the execution of this command, we can see this an ISO that was downloaded to the target, this explains the D:\ seen above:

We can confirm this is the first stage of the payload by looking at the commands following it, where the attacker is attempting to gather further information on the system using commands not typically used by normal users:
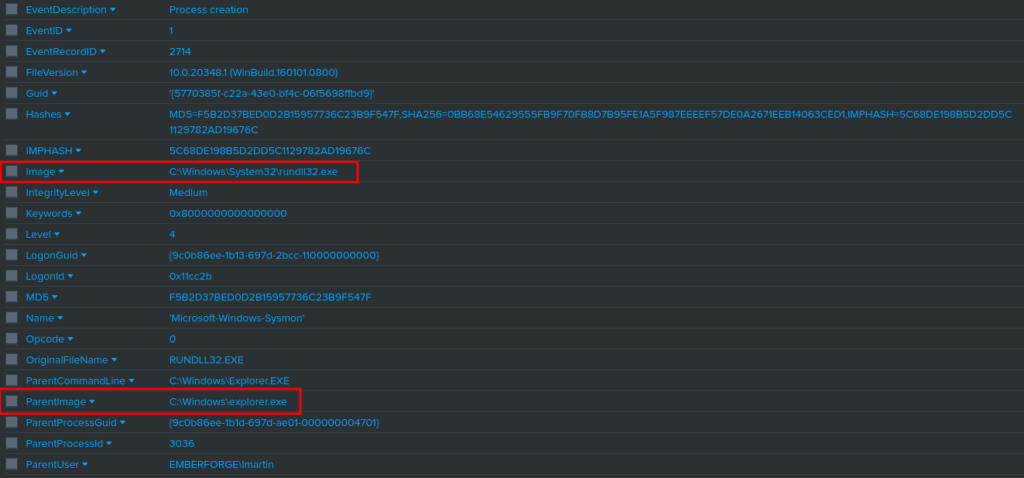
If we wanted to see more information about the initial payload, we can specifically search for it using the following query:
index=main EventCode=1 User="EMBERFORGE\\lmartin" CommandLine="\"C:\\Windows\\System32\\rundll32.exe\" D:\\review.dll,StartW"This will output the parent image and image that directly executed the malicious file. It will also show us hashes which we can use to build IoCs and block the file in our EDR.
We should also take a look at the update.exe file that the attacker is using to establish persistence, just above we search for it directly to see what’s executing it and it’s hashes to block it in our EDR:
index=main EventCode=1 User="EMBERFORGE\\lmartin" CommandLine="\"C:\\Users\\Public\\update.exe\""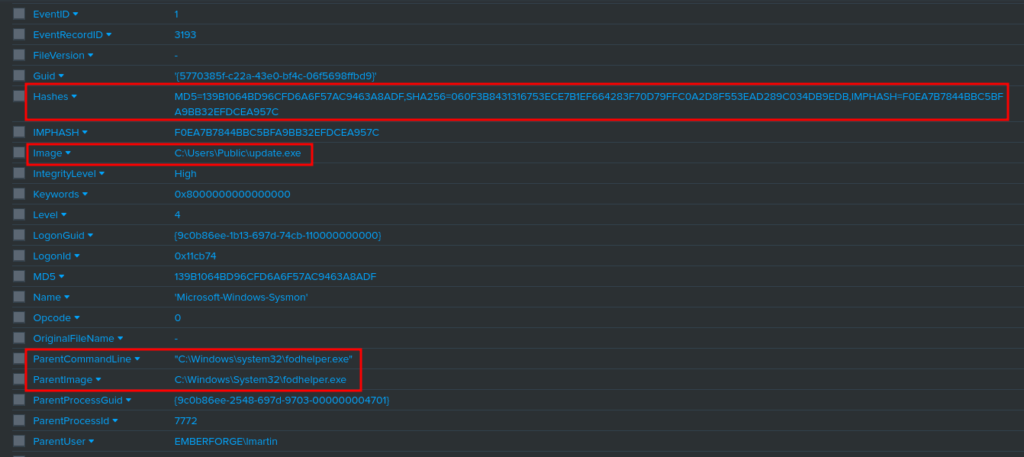
Identifying Command & Control
Now that we have confirmed the presence of a malicious file and established persistence. We need to look at what sort of network connections are being created. This allows us to block the C2 channel. In reality, we would likely have isolated this machine from the network as well. This prevents the attacker from compromising more hosts within our network.
Searching for C2 Domain Names
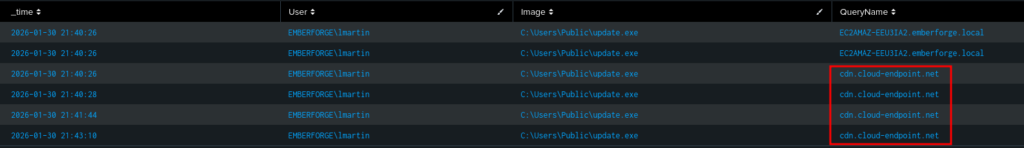
We can use Sysmon EventCode 22 to search for DNS activity from the compromised user:
index=main EventCode=22 User="EMBERFORGE\\lmartin" Image="C:\\Users\\Public\\update.exe" | table _time User Image QueryName |sort _timeRunning the above command we are able to see the domains this binary made queries for:
Searching for C2 IP Addresses
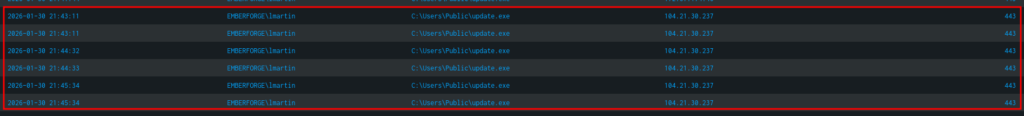
We can search for network connections around the time of original execution of “rundll32.exe/review.dll”. We can use Sysmon EventID 3:
index=main EventCode=3 User="EMBERFORGE\\lmartin" Image="C:\\Users\\Public\\update.exe" | table _time User DestinationIp DestinationPort |sort _timeRunning this, we can see the IP:PORT this malicious binary is calling to:
Post-Compromise
Searching for CreateRemoteThread()
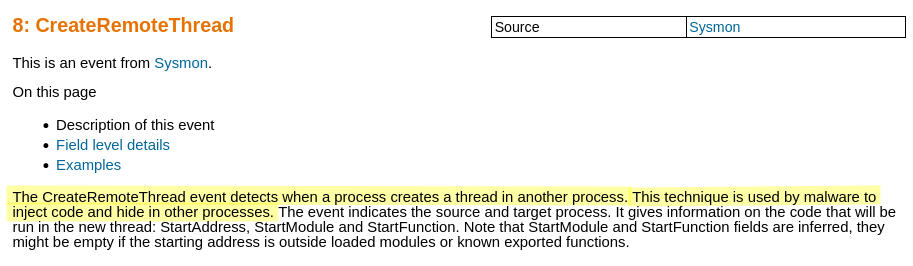
When looking for Post-Compromise activity, we want to attempt to look for the spawning of new processes and privilege escalation attempts. For this we can use Sysmon EventID 8, which allows us to look for the use of CreateRemoteThread, which is commonly used for processes injection and creating threads in other processes:
We can create the following filter in Splunk to search for the computer name, the parent process and the process it spawned:
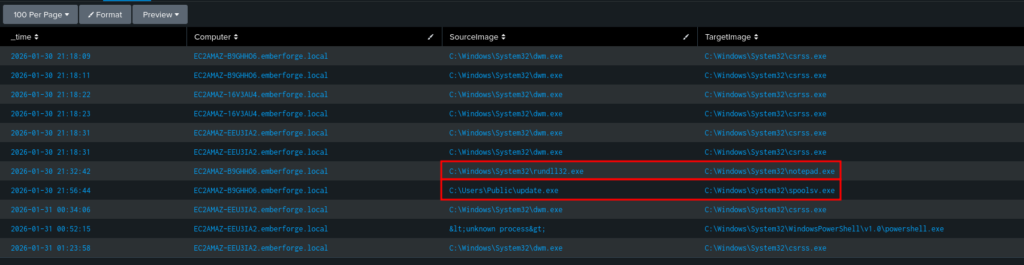
index=main EventCode=8 | table _time Computer SourceImage TargetImage | sort _timeWhen running this we can notice rundll32.exe spawning notepad.exe, this is super odd because notepad is often opened using explorer.exe. Additionally, we can see update.exe running spoolsv:
Persistence
Searching for Process Creation
Using the command we used earlier to look for process creation:
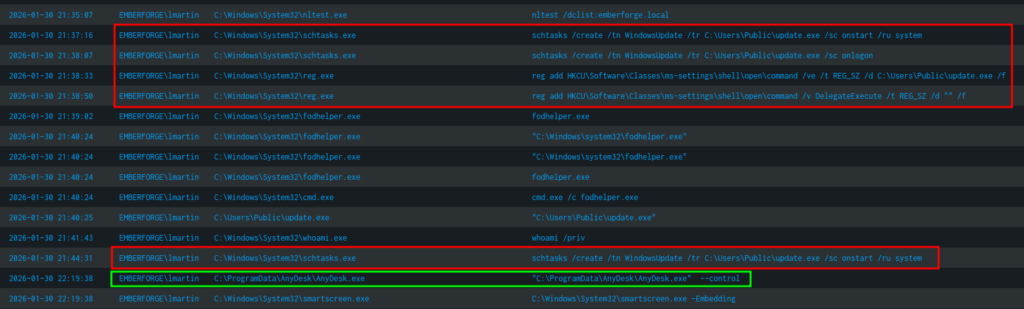
index=main User="EMBERFORGE\\lmartin" EventID=1 | table _time User Image CommandLine | sort _timeWe are looking for any abnormal commands ran to establish persistence. For example schtasks, regedit, etc. After running the above query we can see the attacker created scheduled tasks, added registry keys, and used commercial remote access tools like AnyDesk:
Searching for Backdoor Users
It’s also common for attackers to create a backdoor user, this is so they can login at a later time. These are generally service accounts and created with the intention of flying under the radar. We can use Windows EventCode 4720 to look for created users:
index=main EventCode=4720 | table _time Target_User_Name resultRunning this query shows us a single event:

If we perform a search on this user, we can see the command ran by the attacker to create this user:
index=main svc_backup | table _time User CommandLine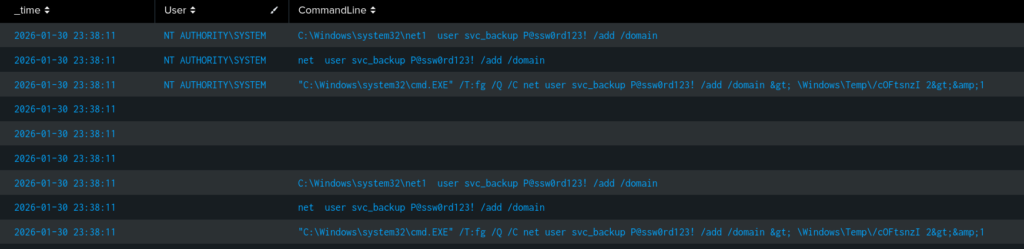
Data Theft
Now that we’ve confirmed the attacker has established persistence, we can begin focusing on what their objective is. This is generally data exfiltration or deployment of ransomware.
Searching for Data Exfiltration
We can use Sysmon EventID 22 exfiltrate the data, we can perform the following search to look for DNS Events domains that are often used to facilitate date exfiltration. MITRE is a great resource for building quick queries like this:
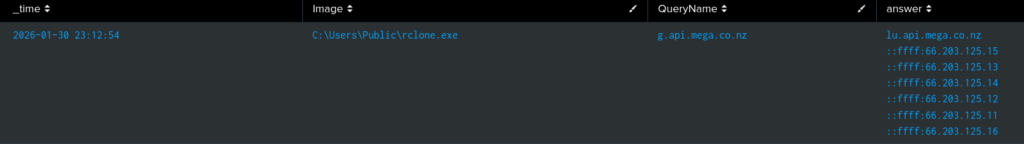
index=main EventCode=22 QueryName=*github* OR QueryName=*onedrive* OR QueryName=*mega* OR QueryName=*dropbox* OR QueryName=*api* QueryName=*curl*| table _time Image QueryName answerThis will show us the following event, showing that a mega API was used and we have a list of IP addresses. We can also see the binary establishing this connection was rclone, which is commonly used to sync files to the cloud:
We can then search for the connection established via rclone using Sysmon EventID 3:
index=main EventCode=3 Image=*rclone.exe | table _time Image DestinationIp DestinationPort | sort _timeRunning the above query, we can see when the data was exfiltrated out of the network and to what IP:

What Next?
Now that we’ve identified what happened, we need to build a list of Indicators of Compromise. This allows us to create detections for the future. These generally consist of the IPs discovered, file hashes, domains, and attacker TTPs.
Indicators Of Compromise(IOCs)
IPs
- 104.21.30.237
- 66.203.125.15
Domains
- cdn.cloud-endpoint.netI look forward to seeing more Blue Team style labs on HackSmarter!
Thanks for Reading! I hope you enjoyed!